- Neurologie
- 2026
What Is an EEG? How Reading Brain Waves Transformed Clinical Neuroscience
The brain is always active. Even during sleep, millions of neurons are firing in coordinated patterns, producing tiny electrical signals that ripple across the scalp. The electroencephalogram (EEG) is the tool that makes those signals visible. Since its introductionWhat an EEG Actually Measures nearly a century ago, [1,2] it has given clinicians and researchers a window into brain activity that no other technology can replicate: continuous, real-time, and non-invasive.
What an EEG Actually Measures
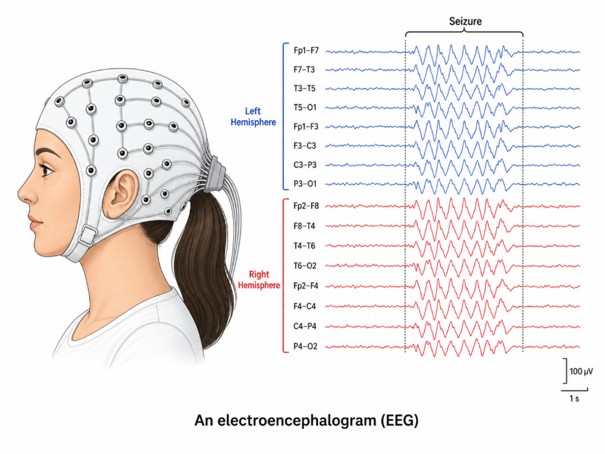
Neurons communicate by exchanging electrical charges across their membranes. When large groups of neurons fire together, as they constantly do, these tiny voltages add up and can be detected from outside the skull. An EEG captures those summed electrical fluctuations through electrodes placed on the scalp, recording the combined activity of millions of neurons simultaneously.[10]
The signals are small, measured in microvolts, roughly a million times weaker than a standard AA battery. But they are structured. The brain produces distinct rhythmic patterns at different frequencies, known as brain waves, each associated with different states of activity: the slow delta waves of deep sleep, the faster beta waves of focused waking thought, and several patterns in between.[10]
What Happens During an EEG
An EEG recording session is straightforward and painless. A technician places a cap or a set of small electrodes across the scalp, most of the time held in position with a conductive gel that improves electrical contact. The electrodes do not deliver any current; they only listen.
During the recording, which lasts anywhere from twenty minutes to several days depending on what the clinician is looking for, the patient may be asked to breathe deeply, look at a flashing light, or simply rest with their eyes closed. Each of these conditions provokes characteristic brain responses that help physicians interpret the data. The result is a multi-channel readout composed of several simultaneous waveforms of electrical activity from different regions of the brain.[10]
What an EEG Reveals
Because the brain electrical patterns are tightly linked to its function, disruptions in those patterns are clinically meaningful. Abnormal spikes or slow waves in specific regions can point to everything from a seizure focus to diffuse brain injury. The EEG does not produce an image of the brain’s structure like MRI or a CT do. What it captures instead is its global state and function: what the brain is doing, moment by moment.[10]
This temporal resolution, meaning the ability to track changes unfolding over milliseconds, is EEG’s defining advantage. Brain processes happen fast, and no current imaging technology matches the EEG’s ability to capture that speed continuously, non-invasively and in real time.[10]
How the EEG Transformed Neurology
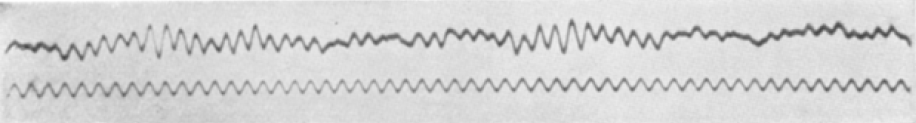
Credits: Hans Berger, “Über das Elektrenkephalogramm des Menschen,” Archiv für Psychiatrie und Nervenkrankheiten, 1929. Via Wikimedia Commons.
Before the EEG, epilepsy was diagnosed almost entirely from patient history and eyewitness accounts of seizures. There was no way to directly observe what was happening in the brain during an episode, or to distinguish epilepsy from other conditions that can cause similar symptoms. The EEG changed that. Characteristic electrical signatures (sharp spikes, spike-and-wave discharges, rhythmic bursts) made it possible to confirm a diagnosis, classify the seizure type, and guide treatment decisions with a degree of precision that had not previously existed.[3,10]
The impact extended well beyond epilepsy. In sleep medicine, the EEG became the foundation of the field: it was EEG recordings in the 1950s that first identified the distinct stages of sleep, including REM sleep,[4,5] overturning assumptions that the sleeping brain was simply inactive. In intensive care, continuous EEG monitoring allows clinicians to detect non-convulsive seizures, i.e., episodes of abnormal electrical activity with no visible physical signs, in critically ill or unconscious patients.[6,7] In disorders of consciousness, EEG patterns help assess whether a patient who appears unresponsive is nonetheless showing signs of awareness.[10]
The EEG Today
Despite being over a century old, the EEG remains a frontline clinical tool. It is fast to set up, relatively inexpensive, and available in hospitals worldwide.[2] Modern amplifiers and digital recording have made the data cleaner and easier to store and share. Ambulatory EEG systems now allow patients to be monitored at home over multiple days, capturing events that a brief in-clinic recording might miss.[8]
More recently, machine learning methods have been applied to EEG data to automate the detection of seizures and other abnormal patterns, reducing the burden on clinicians who would otherwise need to review hours of recordings manually.[9] In research settings, the EEG continues to be a primary tool for studying cognition, attention, and the neural basis of neurological and psychiatric conditions.
AT BIOSERENITY
BIOSerenity builds on this trajectory, focusing on EEG brain monitoring and remote interpretation through miniaturized EEG devices that patients can wear even outside the hospital. BIOSereinty solutions are paired with proprietary AI systems (our large brain model) that help clinicians interpret long recordings faster, providing patients with earlier, clearer answers about their condition.
What has not changed is the fundamental principle: the brain generates electrical activity, that activity is structured and meaningful, and reading it carefully tells you something no blood test or scan can. That insight, first demonstrated in the 1920s,[1,2] remains the foundation of a significant part of modern clinical neuroscience.
References
1. Berger, H. (1929). Über das Elektrenkephalogramm des Menschen. Archiv für Psychiatrie und Nervenkrankheiten, 87(1), 527–570. https://doi.org/10.1007/BF01797193
2. Vergani, A. A. (2024). Hans Berger (1873–1941): the German psychiatrist who recorded the first electrical brain signal in humans 100 years ago. Advances in Physiology Education, 48(4), 878–881. https://doi.org/10.1152/advan.00119.2024
3.Tudor, M., Tudor, L., & Tudor, K. I. (2005). Hans Berger (1873–1941): the history of electroencephalography. Acta Medica Croatica, 59(4), 307–313.
4. Aserinsky, E., & Kleitman, N. (1953). Regularly occurring periods of eye motility, and concomitant phenomena, during sleep. Science, 118(3062), 273–274. https://doi.org/10.1126/science.118.3062.273
5. Liu, D. (2024). The power of direct observation: discovery of REM sleep. Nature Reviews Neuroscience, 25, 579–580. https://doi.org/10.1038/s41583-024-00840-y
6. Claassen, J., Mayer, S. A., Kowalski, R. G., Emerson, R. G., & Hirsch, L. J. (2004). Detection of electrographic seizures with continuous EEG monitoring in critically ill patients. Neurology, 62(10), 1743–1748. https://doi.org/10.1212/01.WNL.0000125184.88797.62
7. Scheuer, M. L. (2002). Continuous EEG monitoring in the intensive care unit. Epilepsia, 43(Suppl. 3), 114–127. https://doi.org/10.1046/j.1528-1157.43.s.3.7.x
8. Tatum, W. O., Desai, N., & Feyissa, A. (2021). Ambulatory EEG: Crossing the divide during a pandemic. Epilepsy & Behavior Reports, 16, 100462. https://doi.org/10.1016/j.ebr.2021.100462
9. Kuhlmann, L., Lehnertz, K., Richardson, M. P., Schelter, B., & Zaveri, H. P. (2018). Seizure prediction — ready for a new era. Nature Reviews Neurology, 14(10), 618–630. https://doi.org/10.1038/s41582-018-0055-2
10. Nayak, C. S., & Anilkumar, A. C. (2023). EEG normal waveforms. In StatPearls. StatPearls Publishing. https://www.ncbi.nlm.nih.gov/books/NBK563295/